After each triathlon race, the first thing I do is to check the race results. I know that I am nowhere near the podium places, but I am really excited to know how I performed against the competition.
You will find below the average times for each triathlon distance and links to my more in-depth articles where you can find details per race and sport.
AVERAGE IRONMAN TIME
I checked all Ironman races from 2019, and I excluded the shortened ones. So the final database consists of 55,123 times from age-groupers.
The average Ironman time is 12h49 min. The women are covering the distance in 13h35 min and the men in 12h38 min. The swim portion lasts 10% of this time (or 1h19 min), the bike 50% (or 6h19), the run 38% (or 4h54 min), and finally, the transitions 2% (17min).
Here is an overview per age group and gender:
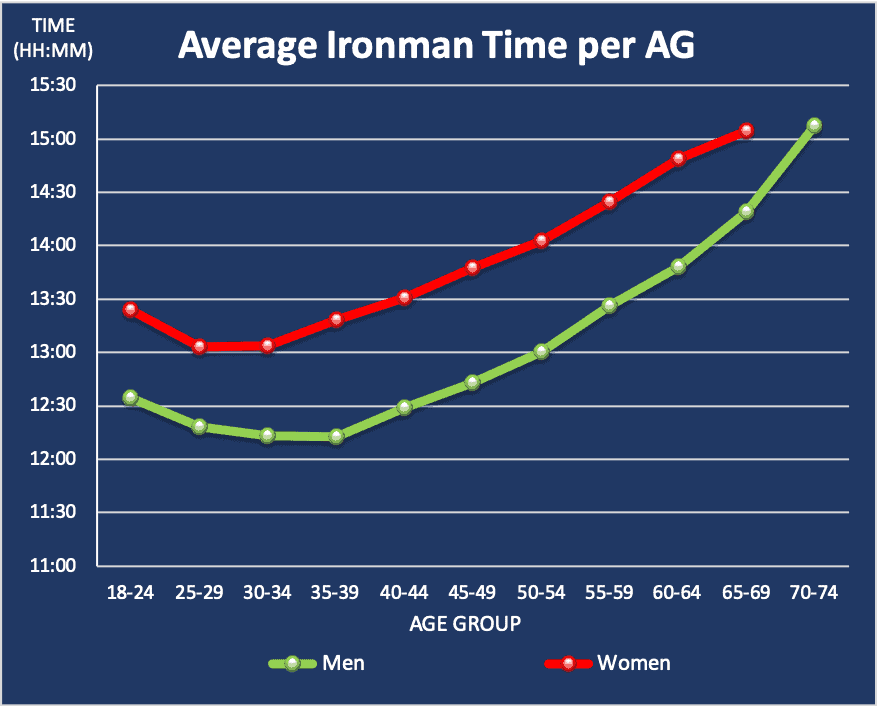
Look at my article Average Ironman Time Per Age Group And Gender for a more in-depth analysis. In addition, you will find the average time per race and a specific section about the World Championship in Kona.
AVERAGE HALF IRONMAN TIME
I checked all 2021 Half Ironman races in North America, Europe, and Oceania. I excluded the ones which were shortened. The final database consists of 74,871 times from age-groupers.
The average Half Ironman time is 6h05 min. The women cover the distance in 6h28 min and the men in 5h58 min. The swim portion lasts 11% of this time (or 40 min), the bike 50% (or 3h02), the run 36% (or 2h11 min), and finally, the transitions 3% (12min).
Here is an overview per age group and gender:
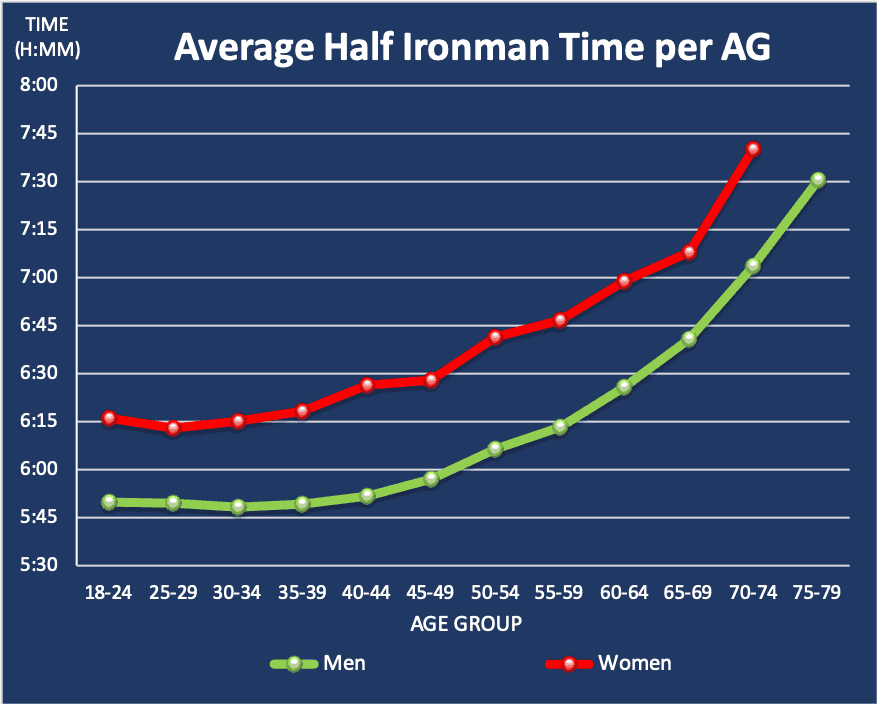
Look at my article Average Half Ironman Time Per Age Group And Gender for a more in-depth analysis. In addition, you will find the average time of all races in North America, Europe, and Oceania.
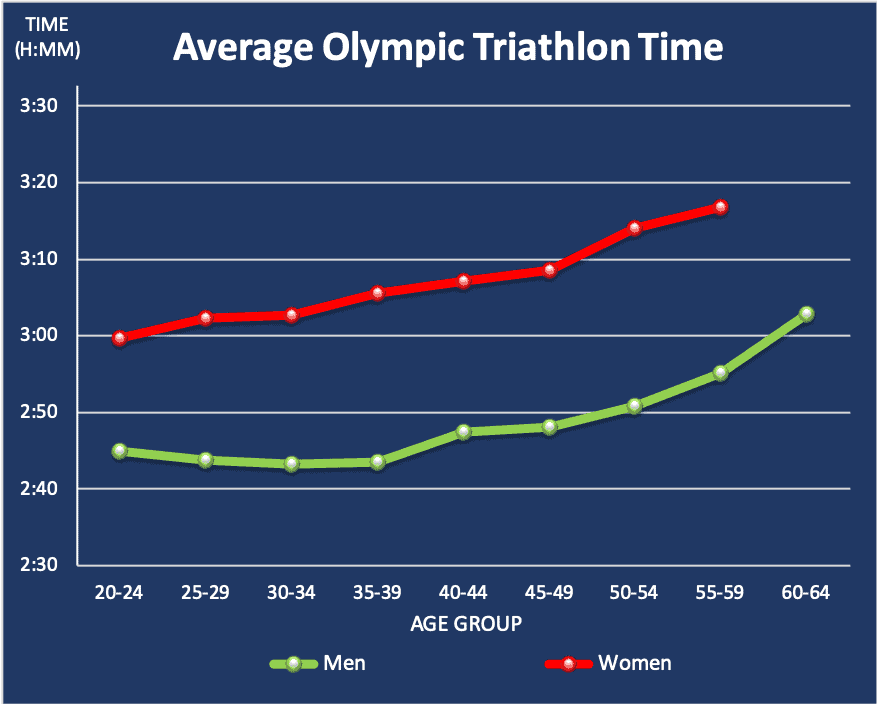
AVERAGE OLYMPIC TRIATHLON TIME
Contrary to the analysis I did on Ironman and Half Ironman times, I simply cannot gather the times of all Olympic distance triathlons. So instead, I picked one representative race that I analyzed in great detail.
I chose Noosa Triathlon for two main reasons: it is the biggest Olympic distance event in the world, and the distances are close to the standard 1.5km-40km-10km. The times are average for 2017, 2018, 2019, and 2021.
The average Olympic Triathlon Time is 2h53 min. The women cover the distance in 3h07 min and the men in 2h47 min. The swim portion lasts 18% of this time (or 30 min), the bike 44% (or 1h17), the run 33% (or 57 min), and finally, the transitions 5% (9min).
Here is an overview per age group and gender:
Look at my article Average Olympic Triathlon Time Per Age Group And Gender for a more in-depth analysis. In addition, you will find the average time per age group for each of the three disciplines.
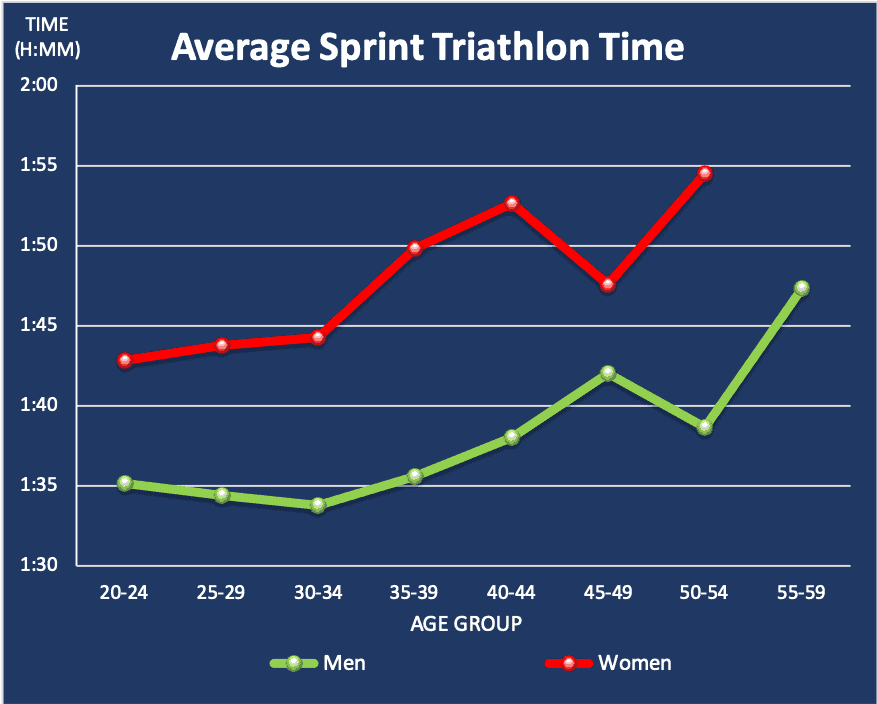
AVERAGE SPRINT TRIATHLON TIME
I chose London Triathlon in Europe as it is the biggest Sprint Distance event in the world that I know of. After analyzing the times and courses of multiple years, I decided to show only 2019 as it is the most representative one.
The average Sprint Triathlon Time is 1h40 min. The women cover the distance in 1h46 min and the men in 1h36 min. The swim portion lasts 18% of this time (or 18 min), the bike 46% (or 46 min), the run 28% (or 28 min), and finally, the transitions 8% (8min).
Here is an overview per age group and gender:
Look at my article Average Sprint Triathlon Time Per Age Group And Gender for a more in-depth analysis. In addition, you will find the average time per age group for each of the three disciplines.
FACTORS INFLUENCING TIME
When comparing your time with those averages, there are a couple of points you need to consider:
- Wetsuit vs. non-wetsuit: As I mentioned already in the article “How to improve your triathlon time,” a wetsuit will make you roughly 7% faster. If you are comparing your time against other races, consider that factor.
- The elevation profile on the bike and run portion: the more elevation gain you have, the slower the course will be.
- Temperature and humidity: depending on where you train and where the race events are, you might need to add or deduct some time for a fairer comparison